
Private equity · 7 min read
Which pricing metrics should an operating partner track?

Key points
- EBITDA shows price changes at a software portfolio company late. Nine pricing metrics show months earlier whether a pricing lever is working: four on price, five on the customer impact.
- Private equity investors should define every pricing metric the same way across all software holdings. Otherwise the review only compares calculation methods.
- For software priced per user, falling seats per customer is a pricing metric that shows revenue loss before any customer cancels.
- Realized price, gross revenue retention and seats per customer are good first pricing metrics for a software portfolio. AI revenue versus AI costs needs a metric of its own.
An operating partner should regularly see nine pricing metrics at a software portfolio company. Four cover the price itself: realized price, discount spread, age of existing-customer prices and enforced price increase. Five show the effect on customers: net and gross revenue retention, plan mix, seats per customer, and AI revenue versus AI costs. These numbers show months before EBITDA whether a pricing lever is working. This article is for operating partners and portfolio teams who steer several software holdings with the same metrics.
Why EBITDA alone comes too late
In the end, the result is what counts. Johannes Benzing, director at Axcel, said in episode 147 that with AI projects they always look at “what the impact on EBITDA is in the end.” The same holds for pricing. But EBITDA only shows the effect of a price change once contracts are renewed and invoices are sent. If you track only the result, you'll notice too late that sales is giving the new price list back through discounts.
Daniel Geiger, operating partner at Rivean Capital, distinguishes three kinds of effects: revenue, efficiency and measures that make other things possible. Pricing clearly belongs in the first group. The metrics below break that revenue down so you can see where it comes from.
The nine metrics
| Metric | How to calculate it | What it shows | Warning sign |
|---|---|---|---|
| 1. Realized price | Revenue per unit after all discounts, relative to list price | How much of the list price actually lands | Falls quarter after quarter |
| 2. Discount spread | Discount per deal, by sales rep and segment | Whether rules exist and whether they're followed | Same offering, very different discounts |
| 3. Age of existing-customer prices | Share of revenue whose price hasn't changed in over two years | Where there's room to move | High share among old large customers |
| 4. Enforced price increase | Realized effect divided by announced effect | Whether announcements reach the customer | Below two-thirds |
| 5. Net revenue retention | Revenue of a customer cohort after twelve months, including expansion, divided by starting revenue | Whether existing customers pay more | Below 100% |
| 6. Gross revenue retention | Like 5, but without expansion | How much revenue is lost to cancellations and downgrades | Drops sharply after a price increase |
| 7. Plan mix | Share of new customers per plan | Whether the tiers steer buyers to the intended level | Almost everyone in the smallest plan |
| 8. Seats per customer | Average users per customer over time | Whether the pricing metric grows with the customer | Falls while the customer stays |
| 9. AI revenue versus AI costs | Revenue from AI plans, add-ons or credits relative to compute costs | Whether AI makes money | Costs rise, revenue stays flat |
The thresholds in the warning sign column are our rules of thumb, not market values. More important than any single threshold is that all holdings calculate the metrics the same way. Otherwise your portfolio review compares definitions instead of results. Listed companies point this out too. In its 2019 IPO prospectus, Slack wrote that there are no uniform standards for its metrics, including net dollar retention, and that other companies might calculate metrics with the same name differently.
What the metrics show together
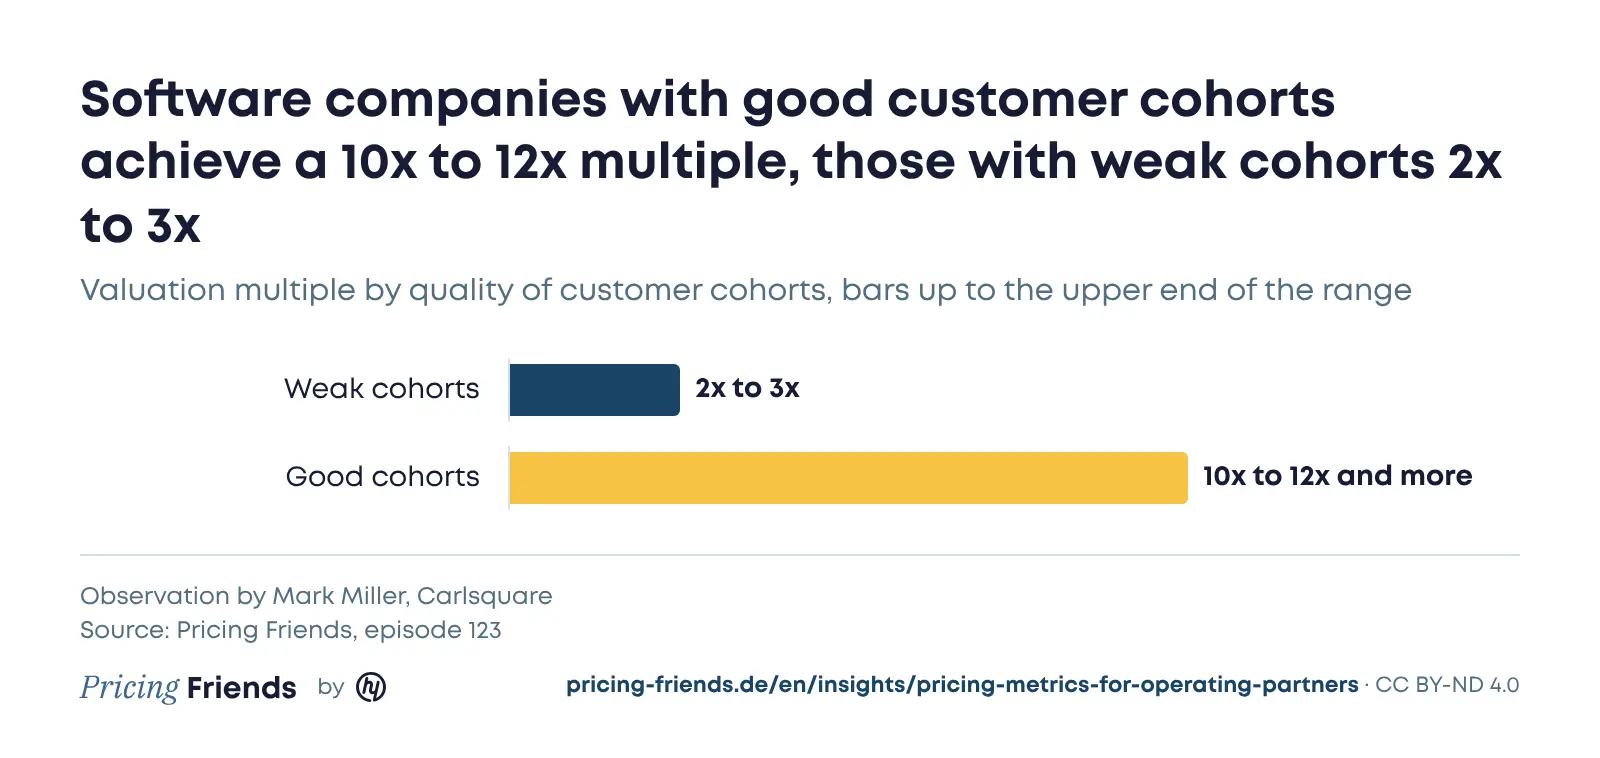
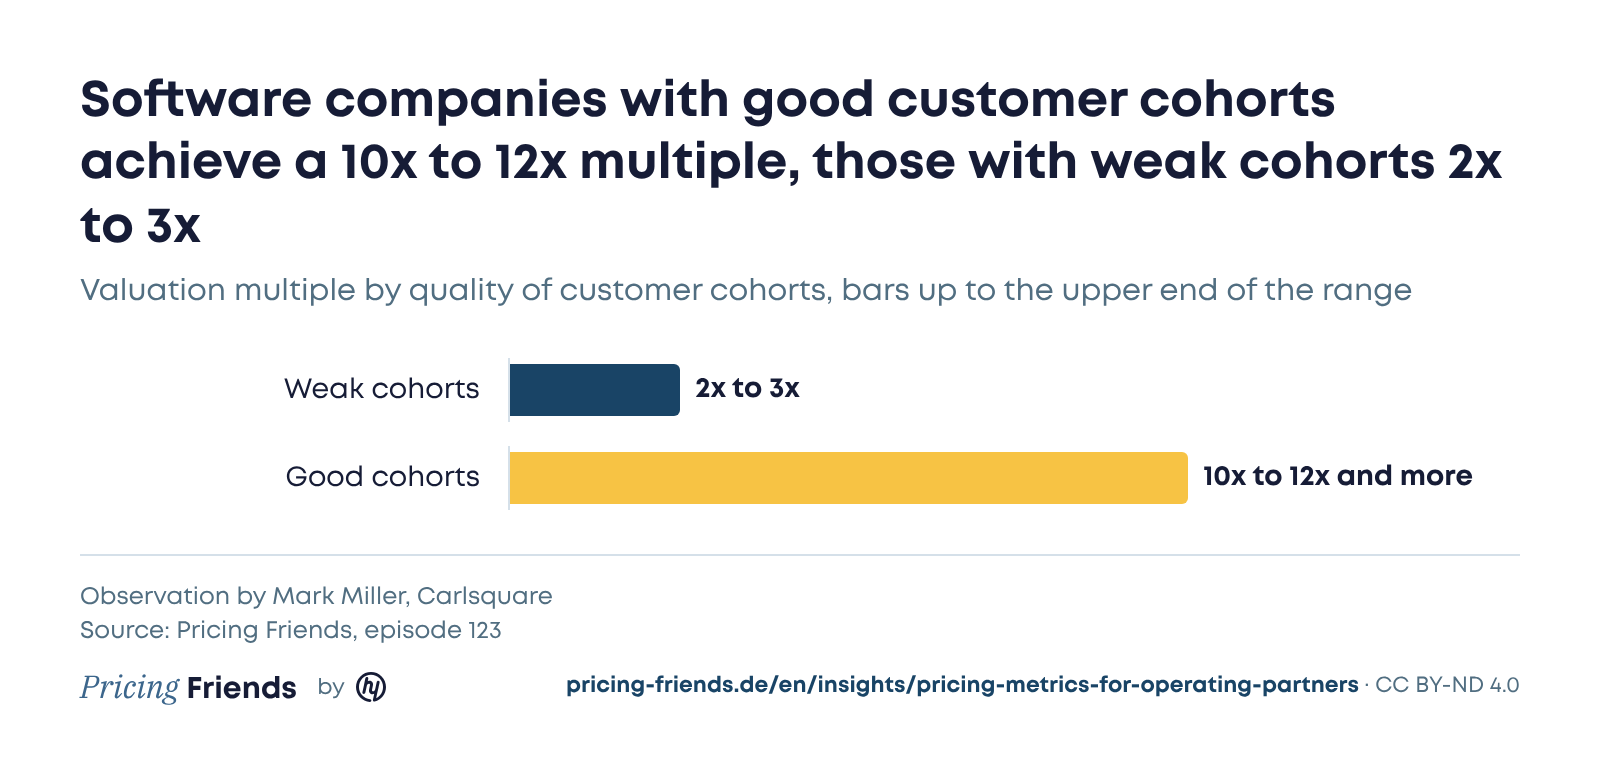
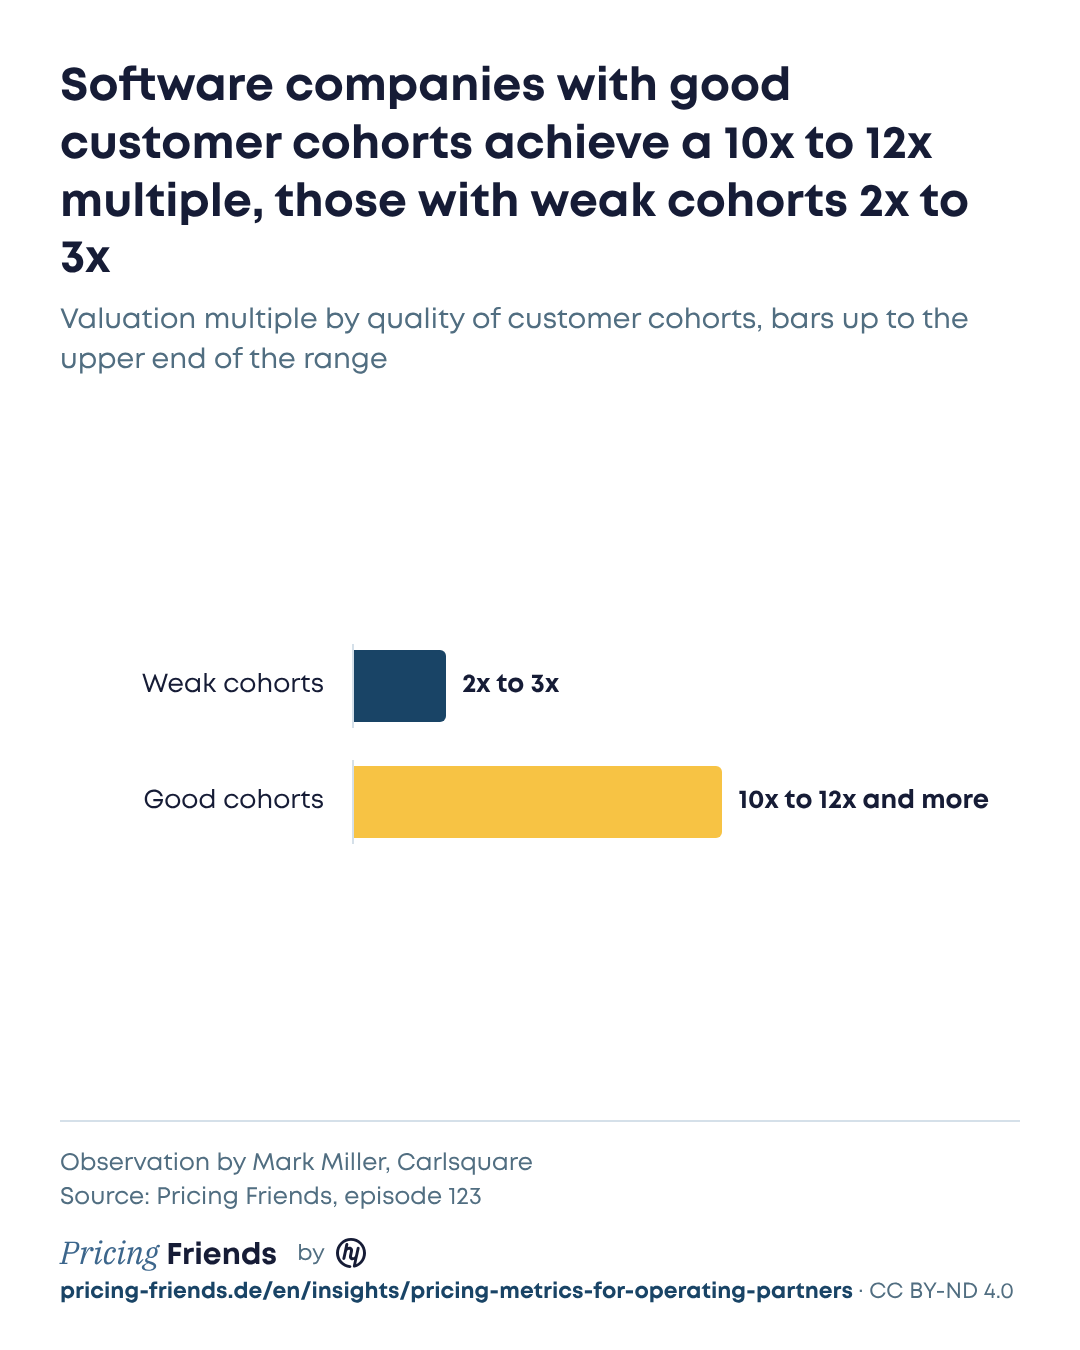
Retention decides the multiple. Mark Miller, founder and managing partner of the M&A advisory firm Carlsquare, described it this way. Buyers today look very closely at gross and net revenue retention and at cohorts. In his observation, weak cohorts put the multiple at two to three, good ones at ten to twelve or higher. The benchmark has shifted: From 2010 to 2021, net revenue retention in the top quartile was 120%, according to the SaaS benchmarks we compiled for our SaaS & AI Pricing Report 2026. In the top decile, it fell by 19 percentage points from 2022 to 2024. Net revenue retention above 100% is once again an achievement buyers pay for.
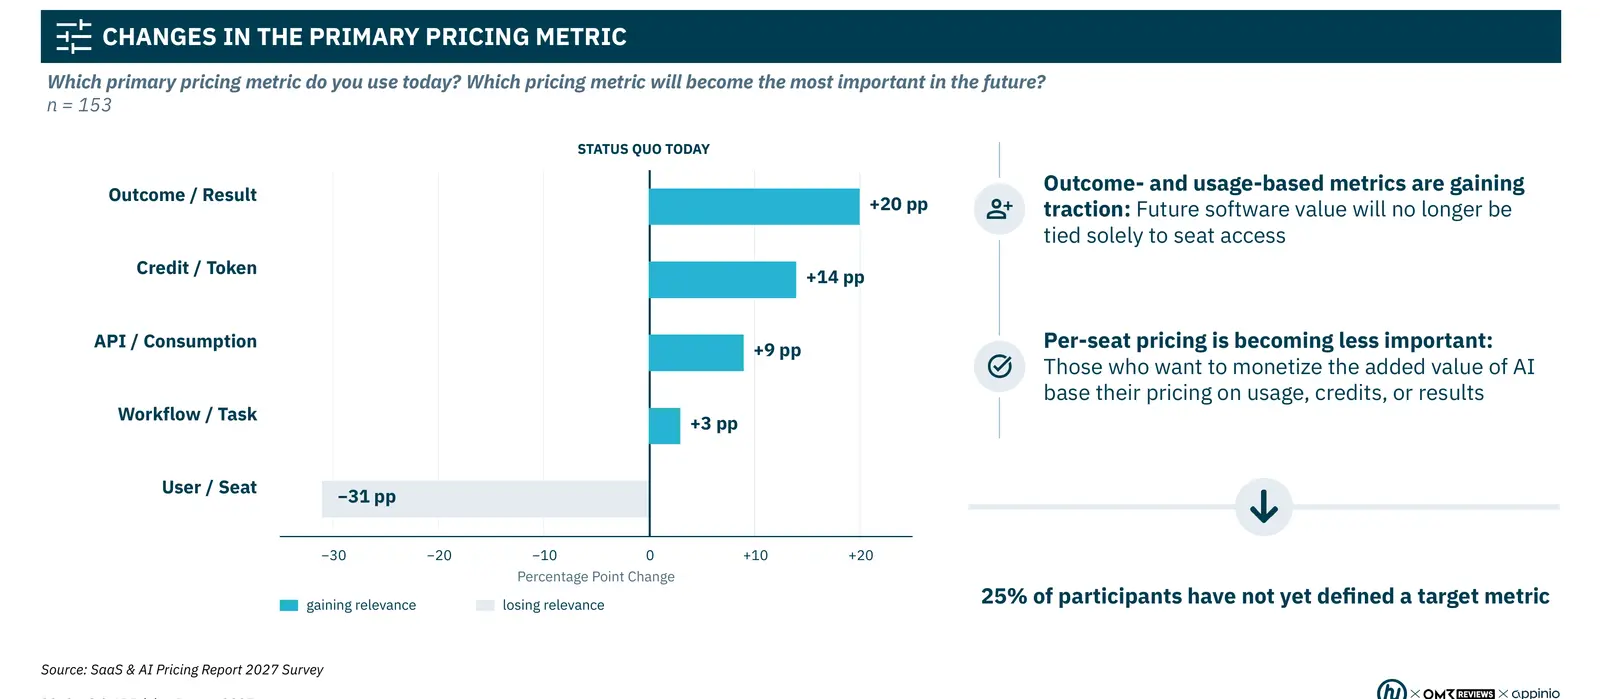
Seats are the early-warning metric. In the survey of 153 SaaS and AI vendors for our SaaS & AI Pricing Report 2027, the seat loses 31 percentage points as the future main metric. 25% of respondents haven't yet defined a target metric. On the podcast, I put it like this: Many customers tend to have fewer users, because in Germany jobs are currently being cut more than created. If seats per customer fall, revenue falls later too, even if no customer cancels. If you want to counter this, plan the switch to usage-based metrics early.
Plan mix shows whether the pricing page is working. In my view, the goal of a three-tier lineup is to sell the middle tier in about 80% of cases. If almost all new customers land in the smallest plan, the middle tier is too expensive or too thin. You can test this with a 30-minute check of your tiers.
AI needs its own line. In the same survey, 22% of vendors don't monetize AI at all yet, and 50% integrate it into the core product. With classic software, additional usage barely mattered. With AI, every interaction costs money. Without metric 9, the operating partner sees the costs in the margin and the missing revenue nowhere.
Enforced price increase separates announcement from effect. In software models, we often see retention of over 90 to 95% after price increases. If gross revenue retention holds and the enforced price increase is still low, the problem usually lies in sales.
How often to look
| Cadence | Metrics |
|---|---|
| Monthly | Realized price, discount spread, enforced price increase during an ongoing adjustment |
| Quarterly | Net and gross revenue retention over the last twelve months, plan mix, seats per customer, AI revenue versus AI costs |
| Semiannually | Age of existing-customer prices, outside view of pricing page and competitors |
The outside view is missing from most dashboards because it doesn't come from the CRM. Still, it shows what buyers and AI assistants read about the price. That's why, when people search for software, it matters whether a company shows or hides its prices.
Our hypothesis: In many software portfolios, seats per customer will become the metric that signals a revenue decline first, long before net revenue retention falls.
What you can do on Monday
- Set a shared definition. Write down a formula for each of the nine metrics and send it to all holdings.
- Start with three metrics. Realized price, gross revenue retention and seats per customer give you the fastest overview.
- Build cohorts. Calculate retention by signing year and segment, not just as an average.
- Request AI costs per customer. Many companies only know them as their vendor's total bill.
- Tie the metrics to the plan. Assign each pricing measure in the value creation plan its own metric.
Bottom line: Nine metrics show earlier than EBITDA whether pricing is working
In EBITDA, an operating partner sees that pricing has worked. In realized price, discount spread, retention, plan mix, seats and AI costs, they see whether it's working right now. These metrics only become comparable across the portfolio with a uniform definition in every holding.
The Portfolio Check delivers the outside view for up to ten holdings at once: You enter the domains and get, for each company, a score from 0 to 100, the pricing model in one line and the most important finding. The overview arrives by email.
Sources
- SaaS & AI Pricing Report 2027 by hy, pp. 12, 21, 32
- SaaS & AI Pricing Report 2026 by hy, pp. 12, 14
- Slack Technologies: Registration Statement (Form S-1) of April 26, 2019, SEC, section Key Business Metrics
- Pricing Friends, episode 5: Private Equity und Pricing mit Andreas Spiegel: Wie revolutioniert effektives Pricing den Wert von Softwareunternehmen?
- Pricing Friends, episode 99: Sonderfolge: SaaS-Pricing, AI und die Zukunft der Preismodelle
- Pricing Friends, episode 123: Software-M&A und Pricing mit Mark Miller: Was entscheidet über den Preis einer SaaS-Company beim Exit?
- Pricing Friends, episode 147: AI Value Creation im Private Equity: Wie wird aus KI-Effizienz echter Umsatz?
Quotes are translated from German. The podcast episodes are in German.