
Packaging · 9 min read
Check your Good-Better-Best tiers: a 30-minute review of your pricing page

Key points
- A Good-Better-Best model with three software tiers should sell the middle tier in about 80% of cases. Three tiers alone don't achieve much.
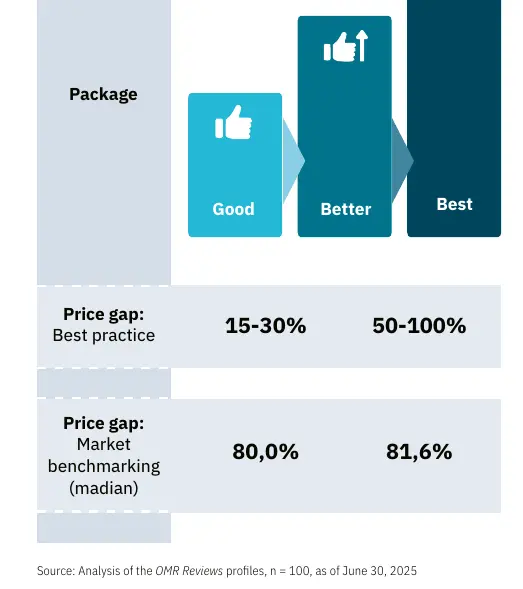
- For Good-Better-Best software tiers, gaps of 15 to 30% to the middle tier and 50 to 100% to the premium tier work well. The first jump is usually too large.
- A visible premium tier with real substance makes the middle software tier look affordable. Fewer than 5% of software vendors on OMR Reviews use an anchor like this.
- Your new customers from the last 12 months show whether your Good-Better-Best software tiers work. If most of them don't land in the middle, the gaps, the anchor or the comparison table are usually off.
If you sell software with several plans, you probably have a Good-Better-Best (GBB) model: an entry plan, a middle plan and a premium plan. Putting three plans side by side is quick. Whether they steer your buyers into the plan you want to sell is a different question. This article is a checklist for a pricing page that's already live. You'll need your pricing page, a calculator, your sales figures from the last 12 months and about 30 minutes.
Why the half hour pays off
Three tiers are the market standard. Together with the German software review platform OMR Reviews, we analyzed the pricing data of 4,397 software profiles on the platform: 38% show exactly three plans and 24% show four. But three plans alone don't achieve much. In our projects, revenue rose by an average of 16% after switching to well-built GBB tiers, and by almost 30% in some cases. No new products were needed. The work was in how the plans were cut and in the price gaps.
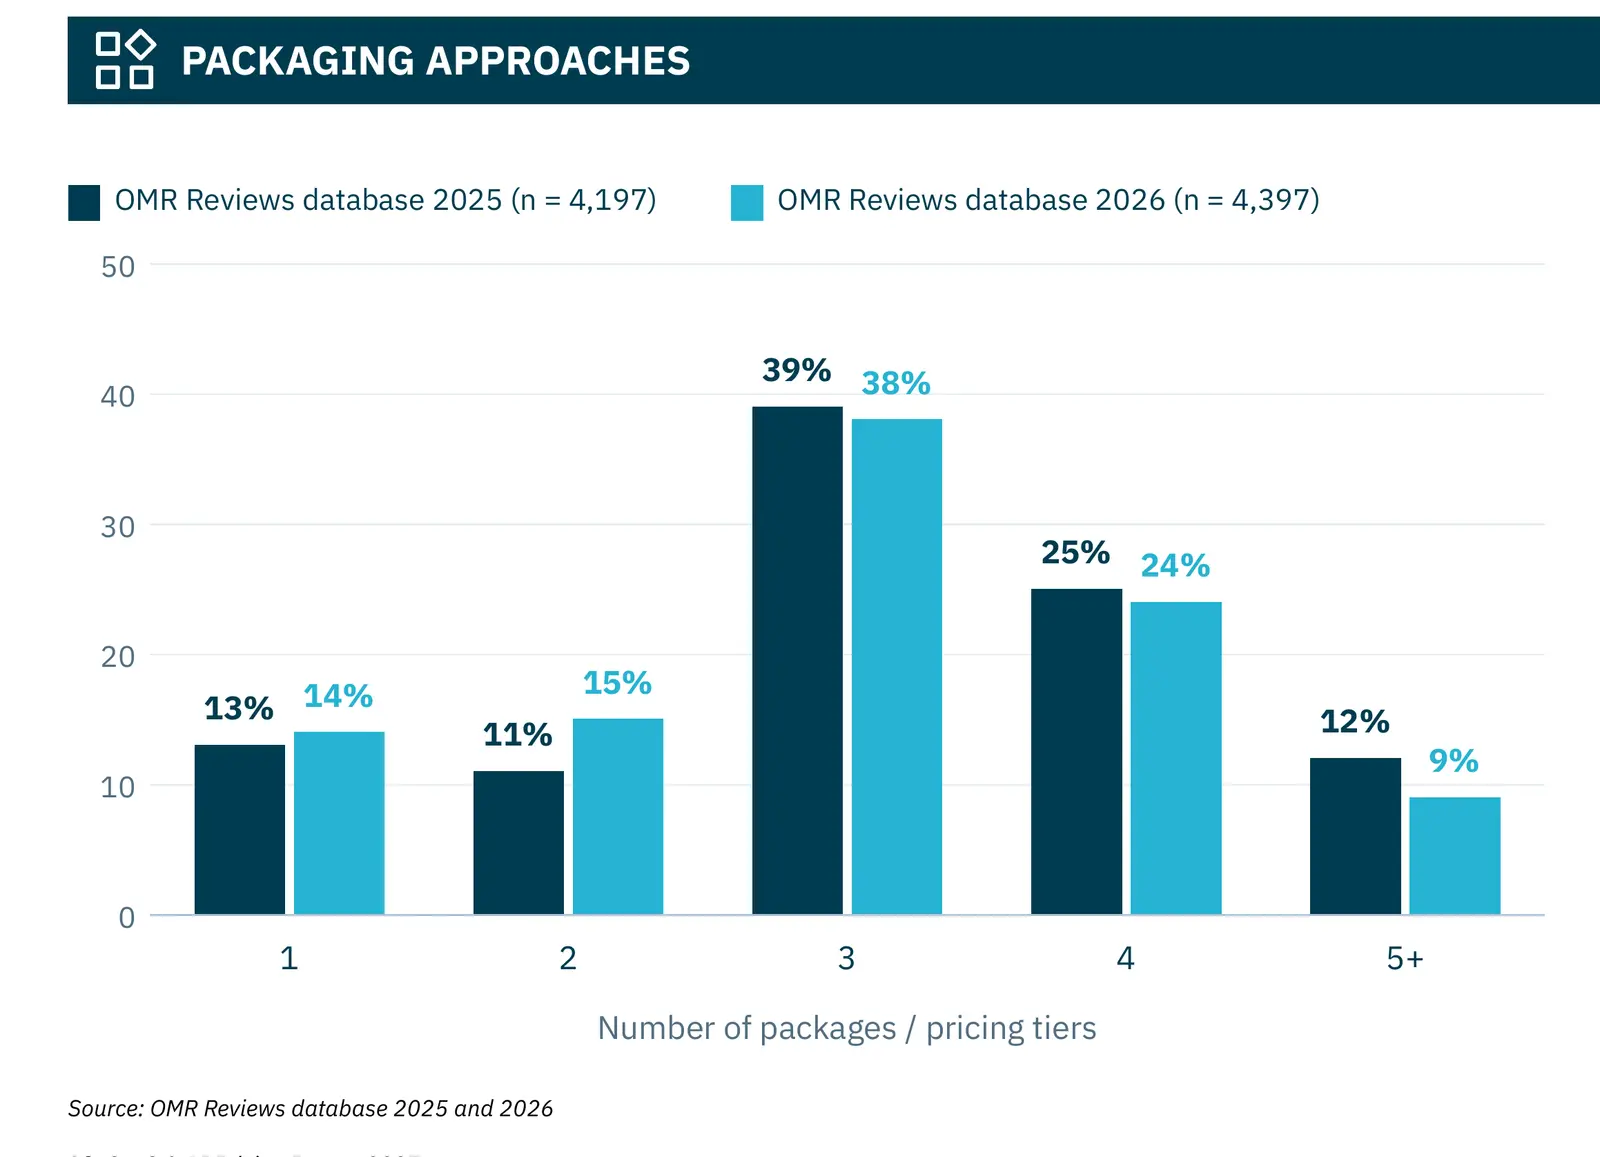
In my view, the goal of a three-tier portfolio is to sell the middle tier in about 80% of cases. If you sell almost nothing but the big plan, you'll eventually need an even bigger one. If you sell almost nothing but the small one, you're leaving money on the table. The following six steps show where your page stands.
Step 1: Count your plans
Open your pricing page the way a new prospect sees it: logged out, with no discount code, in a private browser window. Then count the plans a buyer is actually supposed to choose between.
A free plan on the left or an enterprise plan on request on the right isn't a problem. 62% of the profiles we analyzed show three or four plans, and often that means three plans plus a free or enterprise offer. It gets critical when the actual ladder has more than three steps. In one of our surveys, 97% of respondents could pick a favorite from three options, but only 74% from four. Too few plans come at a cost, too: With only two plans, people mostly buy the cheaper one.
Research outside software also shows that too much choice costs sales. In a field experiment by Sheena Iyengar and Mark Lepper in a gourmet food store, just under 30% of customers who had stopped at the tasting booth later bought jam when six flavors were on display. With 24 flavors, only 3% did.
Step 2: Calculate your price gaps
Divide the price of the middle plan by the price of the entry plan and subtract one. Do the same for the premium plan against the middle plan. Use the same billing period for every plan.
| Gap | Range that works | Market median |
|---|---|---|
| Entry to middle | 15 to 30% | 80.0% |
| Middle to premium | 50 to 100% | 81.6% |
Source: SaaS & AI Pricing Report 2026, p. 32; analysis of 100 profiles on OMR Reviews, as of June 30, 2025.
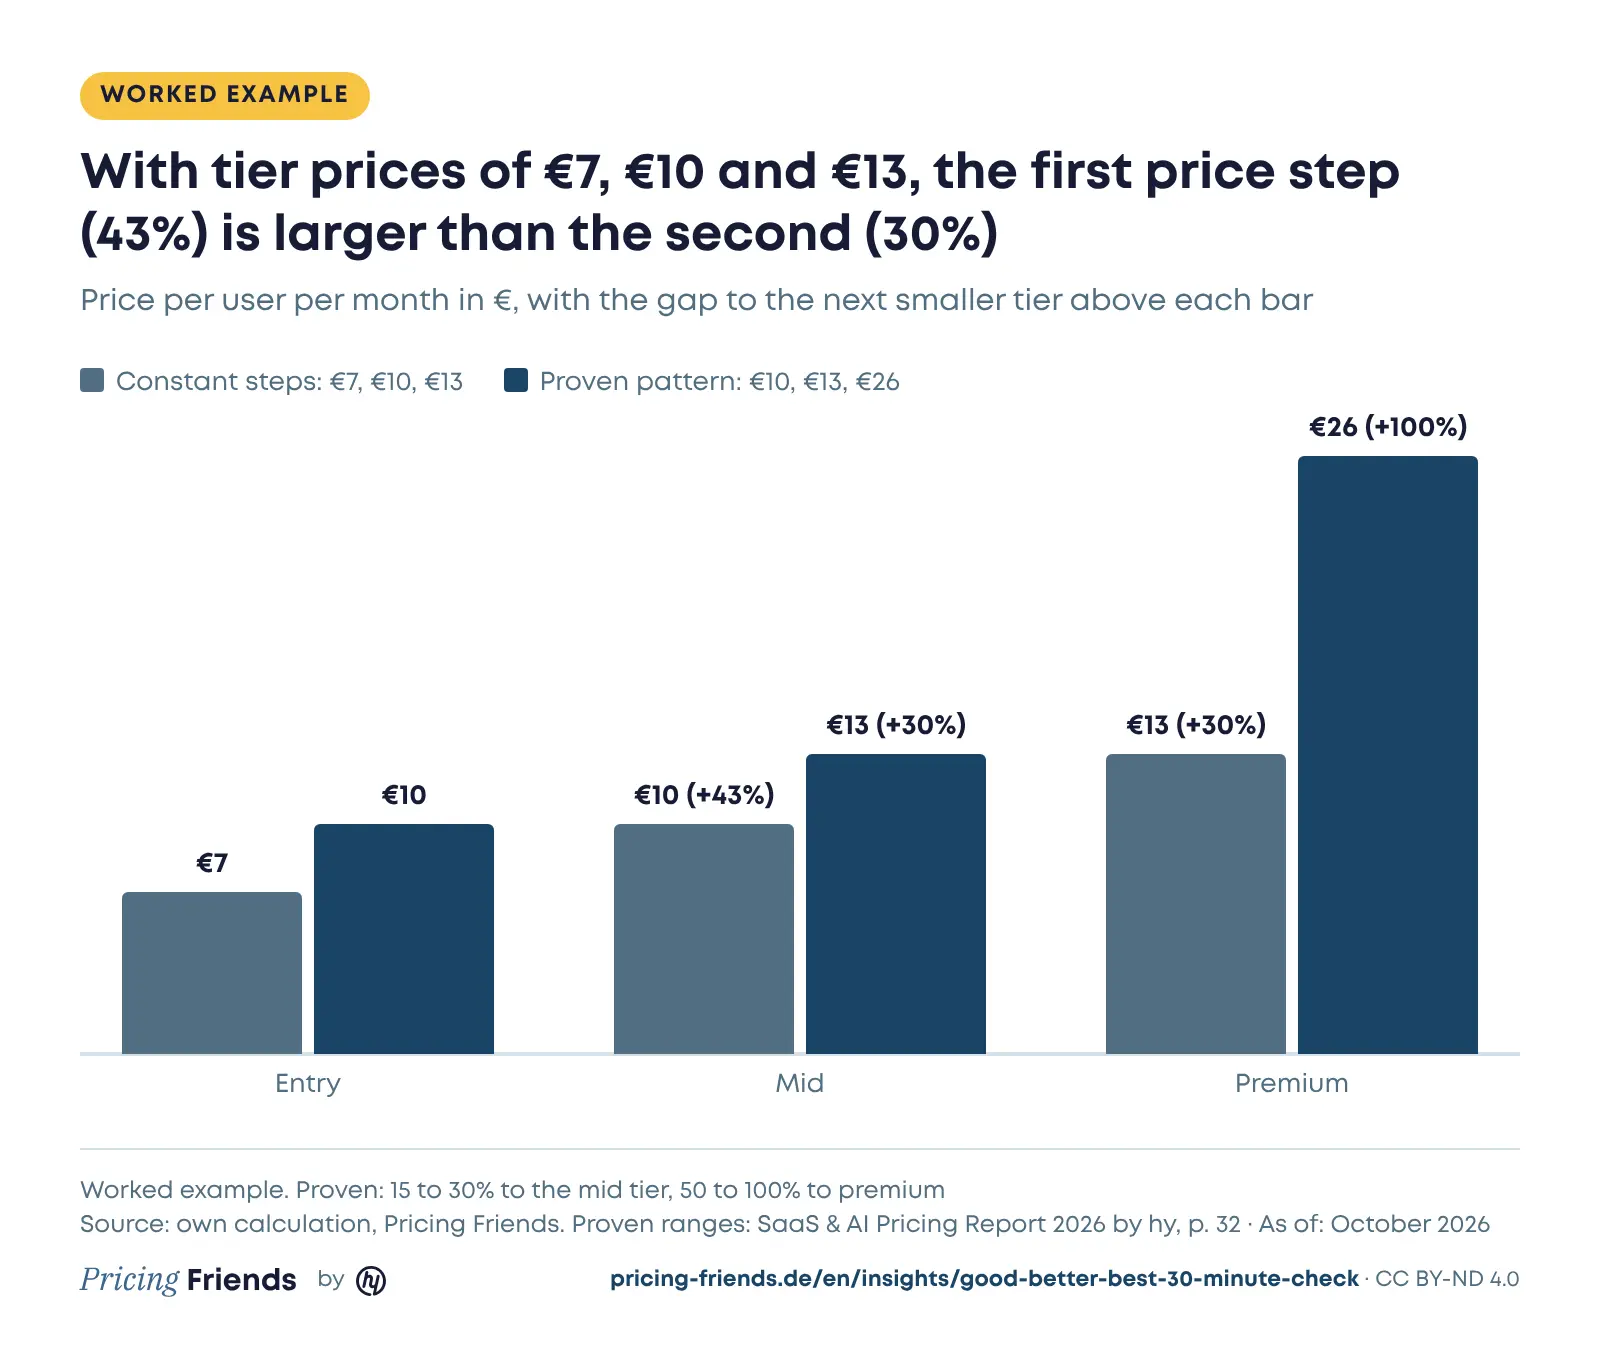
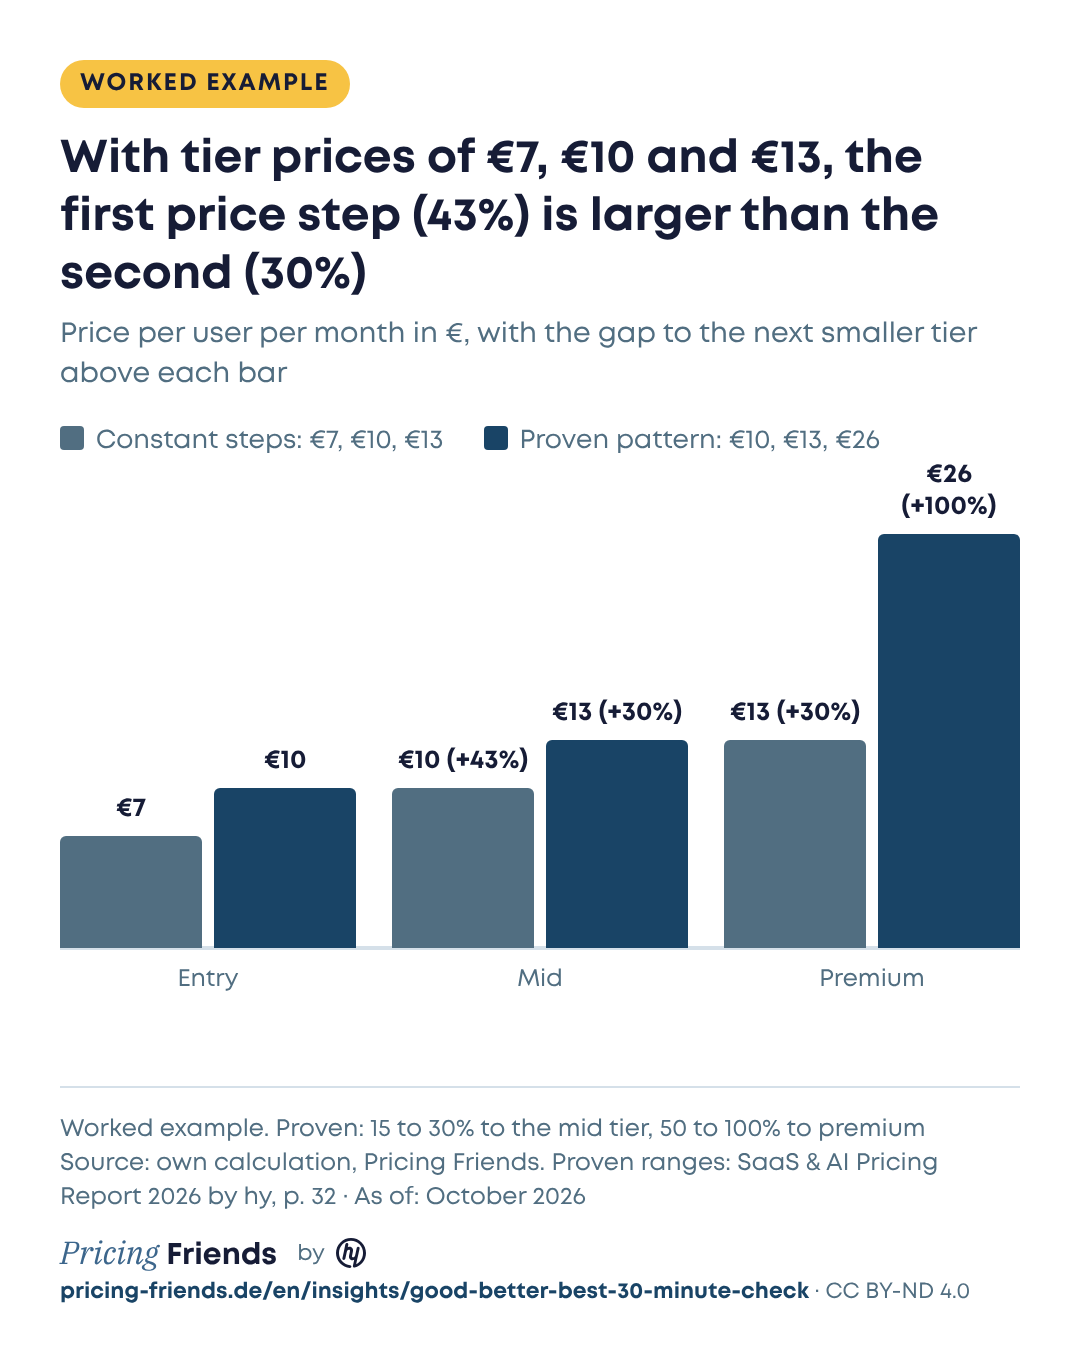
Prices often rise by a constant euro amount per tier, for example €7, €10 and €13 per user. I think that's wrong. In our projects, a different pattern works well: a small first step of roughly 30% and a large second step of roughly 100%. The small first step makes the middle tier attractive, because it offers much more for a small markup. The premium tier serves as a price anchor that makes the middle look affordable.
The market looks different. In our SaaS & AI Pricing Report 2026, the median first jump is almost as large as the second and sits far above the range that works. My colleague Mariella Knospe even describes the jump from the first to the second plan as usually larger than the jump from the second to the third. The €7, €10 and €13 example has exactly this problem: The first step is about 43%, the second 30%.
Worked example: At €10, €13 and €26 per user, the first gap is 30% and the second is 100%. Both fall within the range that works. A gap that's too small also does damage, by the way. It makes the middle plan look worthless. So check both directions.
Step 3: Check the order and the anchor
Look at your most expensive plan. Does it have a visible price that makes the middle look affordable? One example from our analysis shows a large plan at €1,300 next to €329 and €199. Next to €1,300, €329 looks reasonable. Fewer than 5% of vendors on OMR Reviews use a deliberately high anchor plan.
Then check the order. As Europeans, we read from left to right, and the cheapest plan almost always sits on the left. That anchors the buyer on the lowest price, and every further plan feels like a markup. So I recommend reversing the order: Best, Better, Good. The buyer sees the most expensive plan first. With every step to the right, features drop away, and that loss weighs more than the euros saved.
Behind this is loss aversion, which Daniel Kahneman and Amos Tversky described in their 1979 prospect theory: People weigh a loss more heavily than a gain of the same size. My example, which I actually never wanted to use again, is an ice cream. Give a child an ice cream, let them lick it twice and take it away, and the outcry is bigger than the joy was the first time. When I worked at a gaming company, we showed credit packs to existing customers in descending rather than ascending order. The conversion rate stayed the same, and transaction volume rose by 5%. That's a single experience, not a law. Test it with your own buyers.
An anchor needs real substance. Prof. Kai Widdecke of HAW Hamburg put it plainly: “Because once the customer notices that they were manipulated by a decoy or by artificial scarcity and feels bad afterward, they won’t come back.” So the premium plan has to be the right choice for a real customer group.
Step 4: Value propositions instead of checkmarks
Read your comparison table. I'm a fan of writing a clear value proposition for each plan. Good is the entry point for anyone starting out with this kind of software. Better is for more demanding needs, such as customization for the whole business. Best brings enterprise features like deep integrations with other systems.
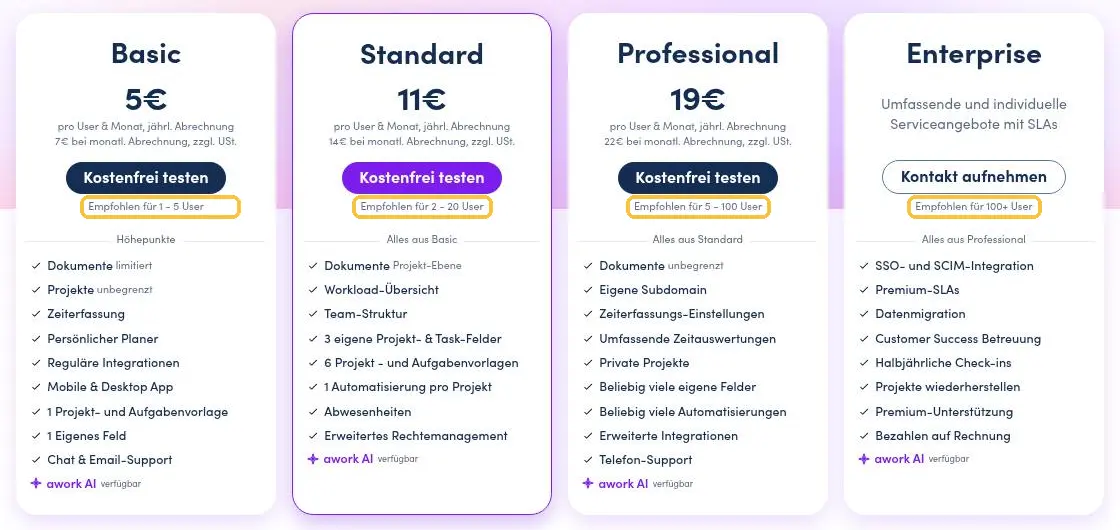
Even large vendors often show 30 checkmarks or more. Instead, put the three or four differences that really matter up front, and highlight the middle plan: in the center, larger, marked in color. In most cases, I'd differentiate the plans by features, not by hard steps in user count. Every plan needs a visible added value over the smaller one, so customers understand what they're paying more for.
Step 5: Sort your add-ons
List everything customers can buy in addition. Mariella Knospe has described a simple grid for this. What almost all customers need belongs in the base plan. What a smaller share values can drive the upsell into the middle plan. And: “If the value is extremely high but the user base is extremely small, then of course you have to think about an add-on to monetize it as well as possible.”
The same applies to AI features. We sort them by usage and customer value: high usage with little added value goes into the core product, high usage with high value becomes a difference between tiers, and high value for a small target group becomes an add-on. Of the 153 software and AI vendors we surveyed for the current report, 50% put AI into the core product and 15% sell it as an add-on. If you've put AI features in your entry plan, check whether the running cost per use is squeezing that plan's margin.
Step 6: Compare against your sales figures
Pull the split of new customers across plans for the last 12 months from your CRM or billing system. Does the majority land in the middle? If not, steps 2 to 4 show you where the problem is.
Look at your existing customers, too. Once customers get used to a plan, they often stay on it for a few years. Upgrading them later is hard. That's why it pays to get new customers onto the bigger plan during the trial. One way is a reverse trial instead of a classic free trial: The customer tests the Best plan for a limited time at the price of the entry plan or for free, and decides afterward.
What to do with the result
After 30 minutes, you'll have a list of gaps. Highlighting the middle plan, showing a visible price for the premium plan and shortening comparison tables are quick changes. New price gaps or a new order should be tested and aligned with your sales team, because they have to explain the plans in conversations. Newly cut plans affect your existing customers and need a migration plan.
If you don't want to run the check by hand, you'll get a first read in about a minute with the free pricing audit on pricing-friends.de. It reads your pricing page live, checks pricing model, packaging, price points and entry offer, and gives a score from 0 to 100 with findings. It applies the approach hy Consulting Group developed in more than 600 pricing projects. The full data with all charts is in the SaaS & AI Pricing Report 2027, which we published with OMR Reviews and Appinio.
Bottom line: Doing the math beats gut feeling
Many vendors have three plans and a comparison table. Far fewer have price gaps within the range that works, a visible anchor and a well-thought-out order. The market median of about 80% per tier shows how often the first jump is too large, and fewer than 5% use a deliberate anchor. You can measure both in half an hour. Afterward, you'll know whether your pricing page steers buyers to the middle or keeps them stuck in the entry plan.
Sources
- SaaS & AI Pricing Report 2027 by hy, pp. 18, 21, 26
- SaaS & AI Pricing Report 2026 by hy, pp. 29, 30, 31, 32, 44
- Sheena S. Iyengar and Mark R. Lepper: When Choice is Demotivating: Can One Desire Too Much of a Good Thing?, Journal of Personality and Social Psychology 79 (6), 2000
- Daniel Kahneman and Amos Tversky: Prospect Theory: An Analysis of Decision under Risk, Econometrica 47 (2), 1979
- Pricing Friends, episode 91: Behavioral Pricing mit Kai Widdecke: Kaufen wir am Bildschirm mehr als am Schalter?
- Pricing Friends, episode 99: Sonderfolge: SaaS-Pricing, AI und die Zukunft der Preismodelle, Dr. Sebastian Voigt bei Julius Göllner
- Pricing Friends, episode 142: SaaS- und AI-Pricing mit Mariella Knospe und Felix Rahlmeyer: Wie bepreist man Software und AI im Jahr 2027?
Quotes are translated from German. The podcast episodes are in German.