
Private equity · 7 min read
How much EBITDA leverage is in a portfolio company's pricing?

Key points
- A price increase for a software company's existing customers lands almost entirely in EBITDA. At a 20% margin, prices 5% higher lift EBITDA by a quarter on paper.
- With a 10% price increase, a software company can lose 9.1% of revenue to cancellations before revenue falls. Losses rarely get that high.
- Software vendors mostly raise prices by up to 20%, and many raise them regularly by around 10%. Prices for existing customers that haven't changed in years often leave more room.
- A software company's bigger EBITDA lever often lies in discount discipline, plans and the pricing model. If products are interchangeable or customers need fewer seats, the pricing model has to be rebuilt.
A software holding's pricing usually holds the most direct EBITDA lever an investor has: Every percent of price you add to existing revenue lands almost entirely in earnings, because costs stay the same. At a company with a 20% EBITDA margin, prices 5% higher lift EBITDA by a quarter on paper, as long as hardly any customers leave. This piece is for operating partners and investment teams who want to put a number on the lever for a portfolio company before it goes into the value creation plan.
The mechanism: earnings and multiple
Andreas Spiegel, founder of DRS Investment, put it briefly: Pricing is an important lever “because a price increase typically goes one-to-one into earnings.” That's especially true for software, since an additional license costs almost nothing. With AI features, it only partly holds, because every use triggers compute costs.
The second effect works through the multiple. Dr. Stephan Schmid of BU Bregal Unternehmerkapital names three drivers of the multiple: growth, profitability and risk profile. A better pricing model contributes to all three. There's also a signal to buyers: “A company that can successfully reset its prices, that says something about the strength of its customer relationships.” By his account, it's hard to calculate exactly how many turns of multiple that adds. When a company moves from perpetual licenses to subscription, in his experience it's “certainly a few multiple turns on EBITDA” compared with otherwise similar companies.
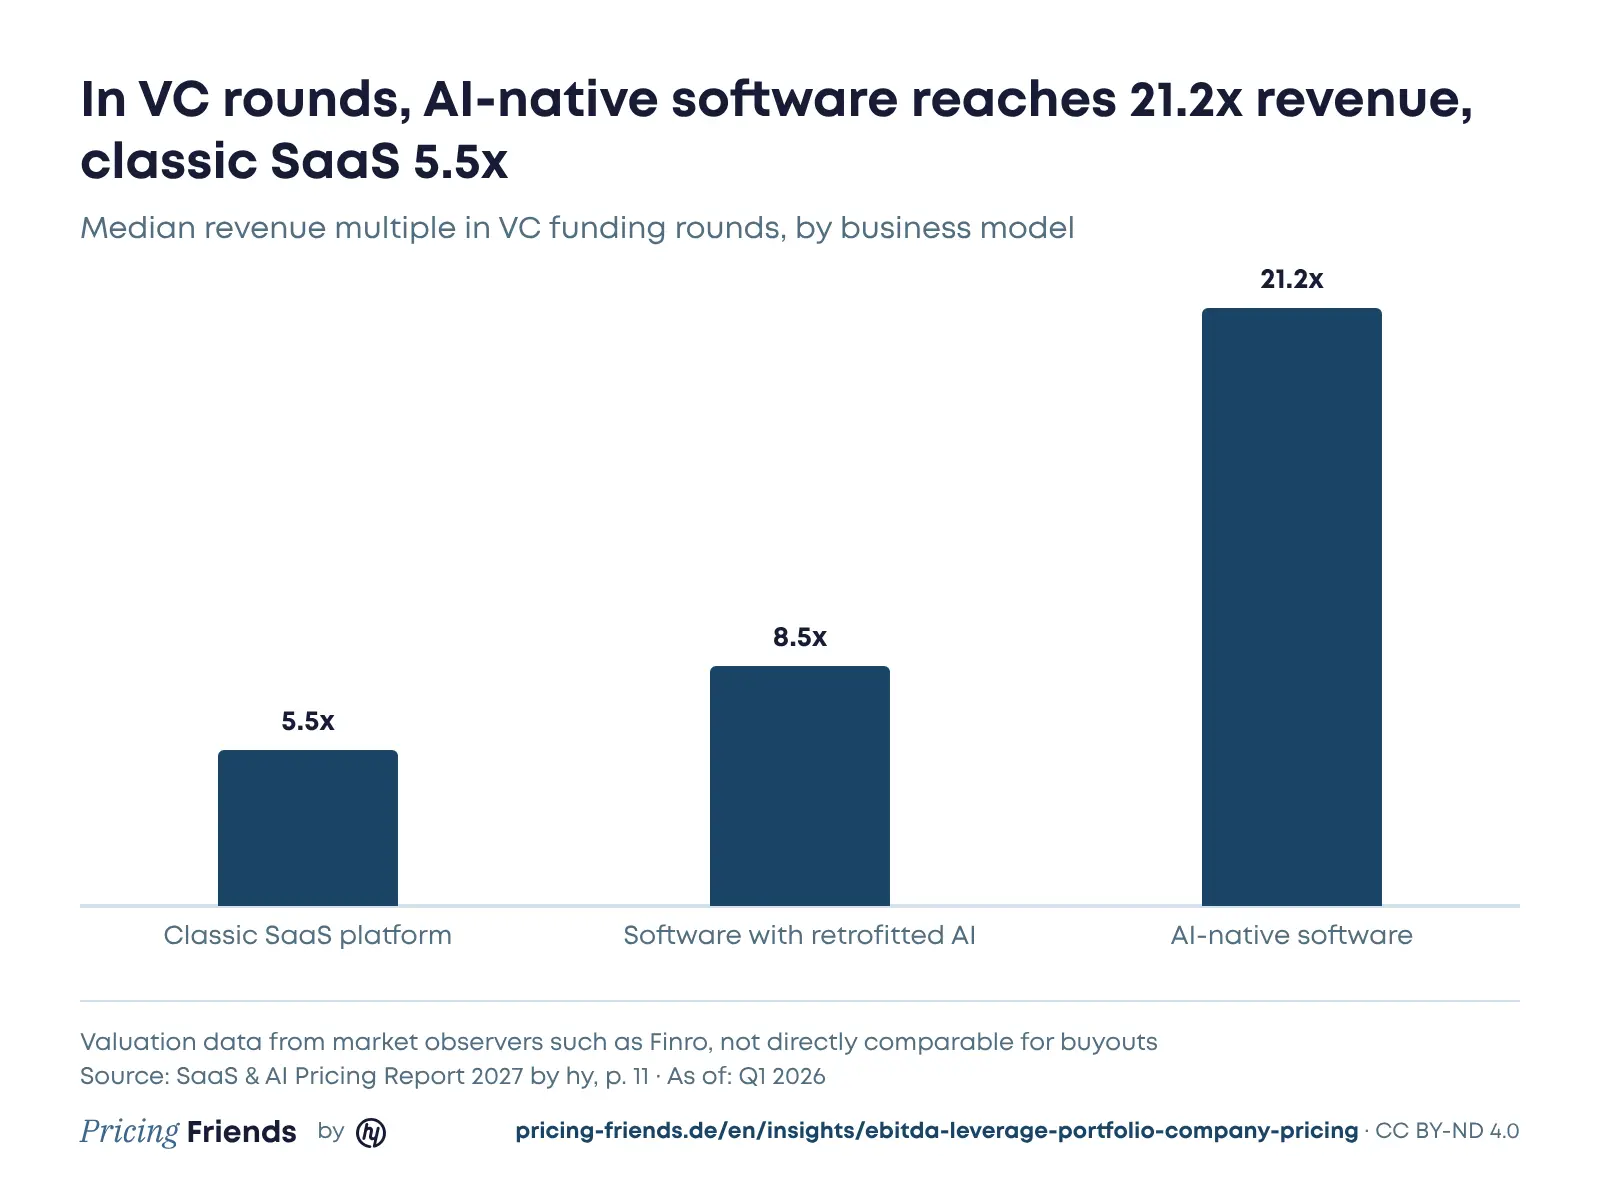
How heavily buyers weigh the business model shows in a comparison from our SaaS & AI Pricing Report 2027, which pulls together valuation data from market observers such as Finro. In VC funding rounds in the first quarter of 2026, the median revenue multiple was 5.5x for classic SaaS platforms, 8.5x for software with retrofitted AI and 21.2x for AI-native software. These aren't direct benchmarks for buyouts. They still show the direction: How a company makes money is worth money to buyers.
Worked example: a holding with €20 million in revenue
The figures are assumptions. A software company has €20 million in revenue, €16 million of it recurring from existing customers, and €4 million in EBITDA. It raises prices for existing customers by 6%. As a result, customers representing 2% of recurring revenue cancel as a result. We leave out the costs saved on departed customers, so the calculation tends to be conservative.
| Before | After 6% price increase and 2% churn | |
|---|---|---|
| Recurring revenue | €16.0 million | €16.62 million |
| Total revenue | €20.0 million | €20.62 million |
| EBITDA | €4.0 million | €4.62 million |
| EBITDA margin | 20.0% | 22.4% |
| Enterprise value at an assumed 12x EBITDA | €48.0 million | €55.4 million |
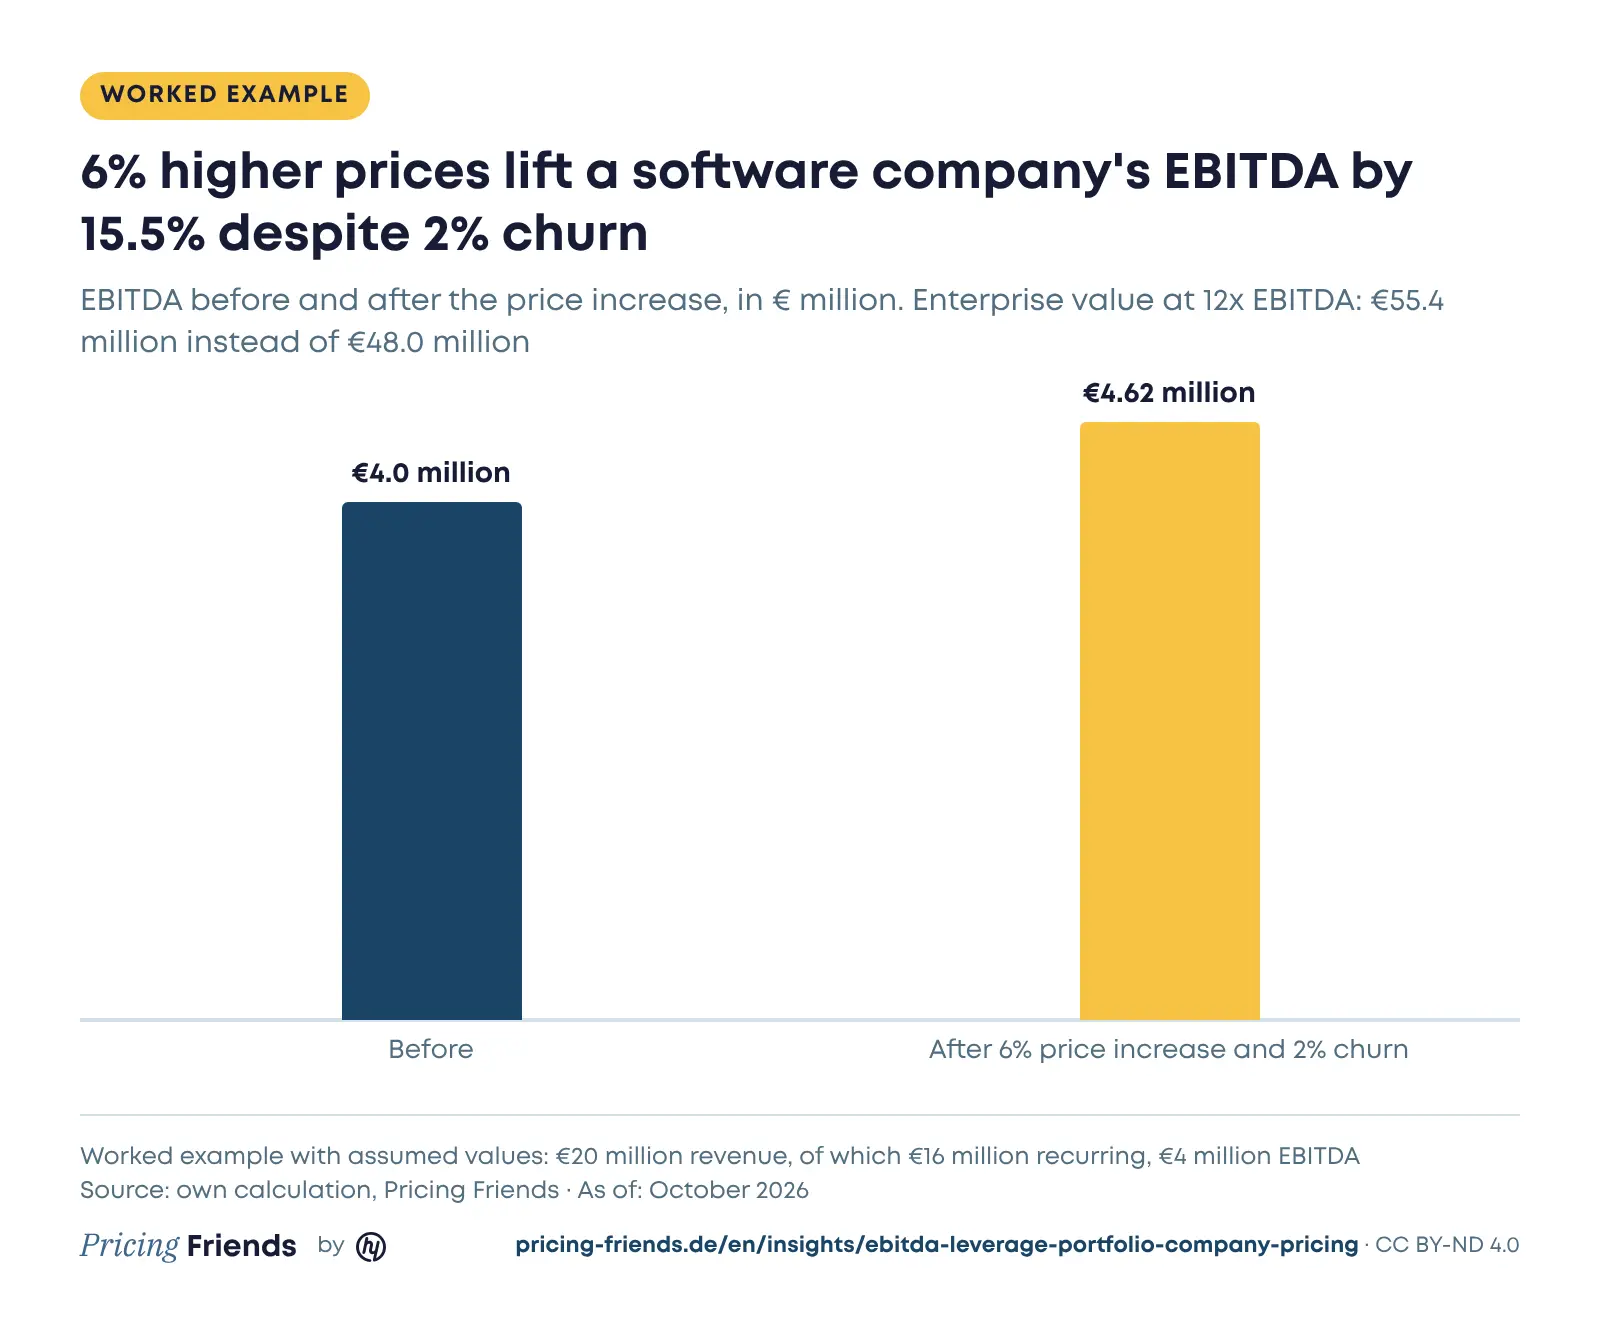
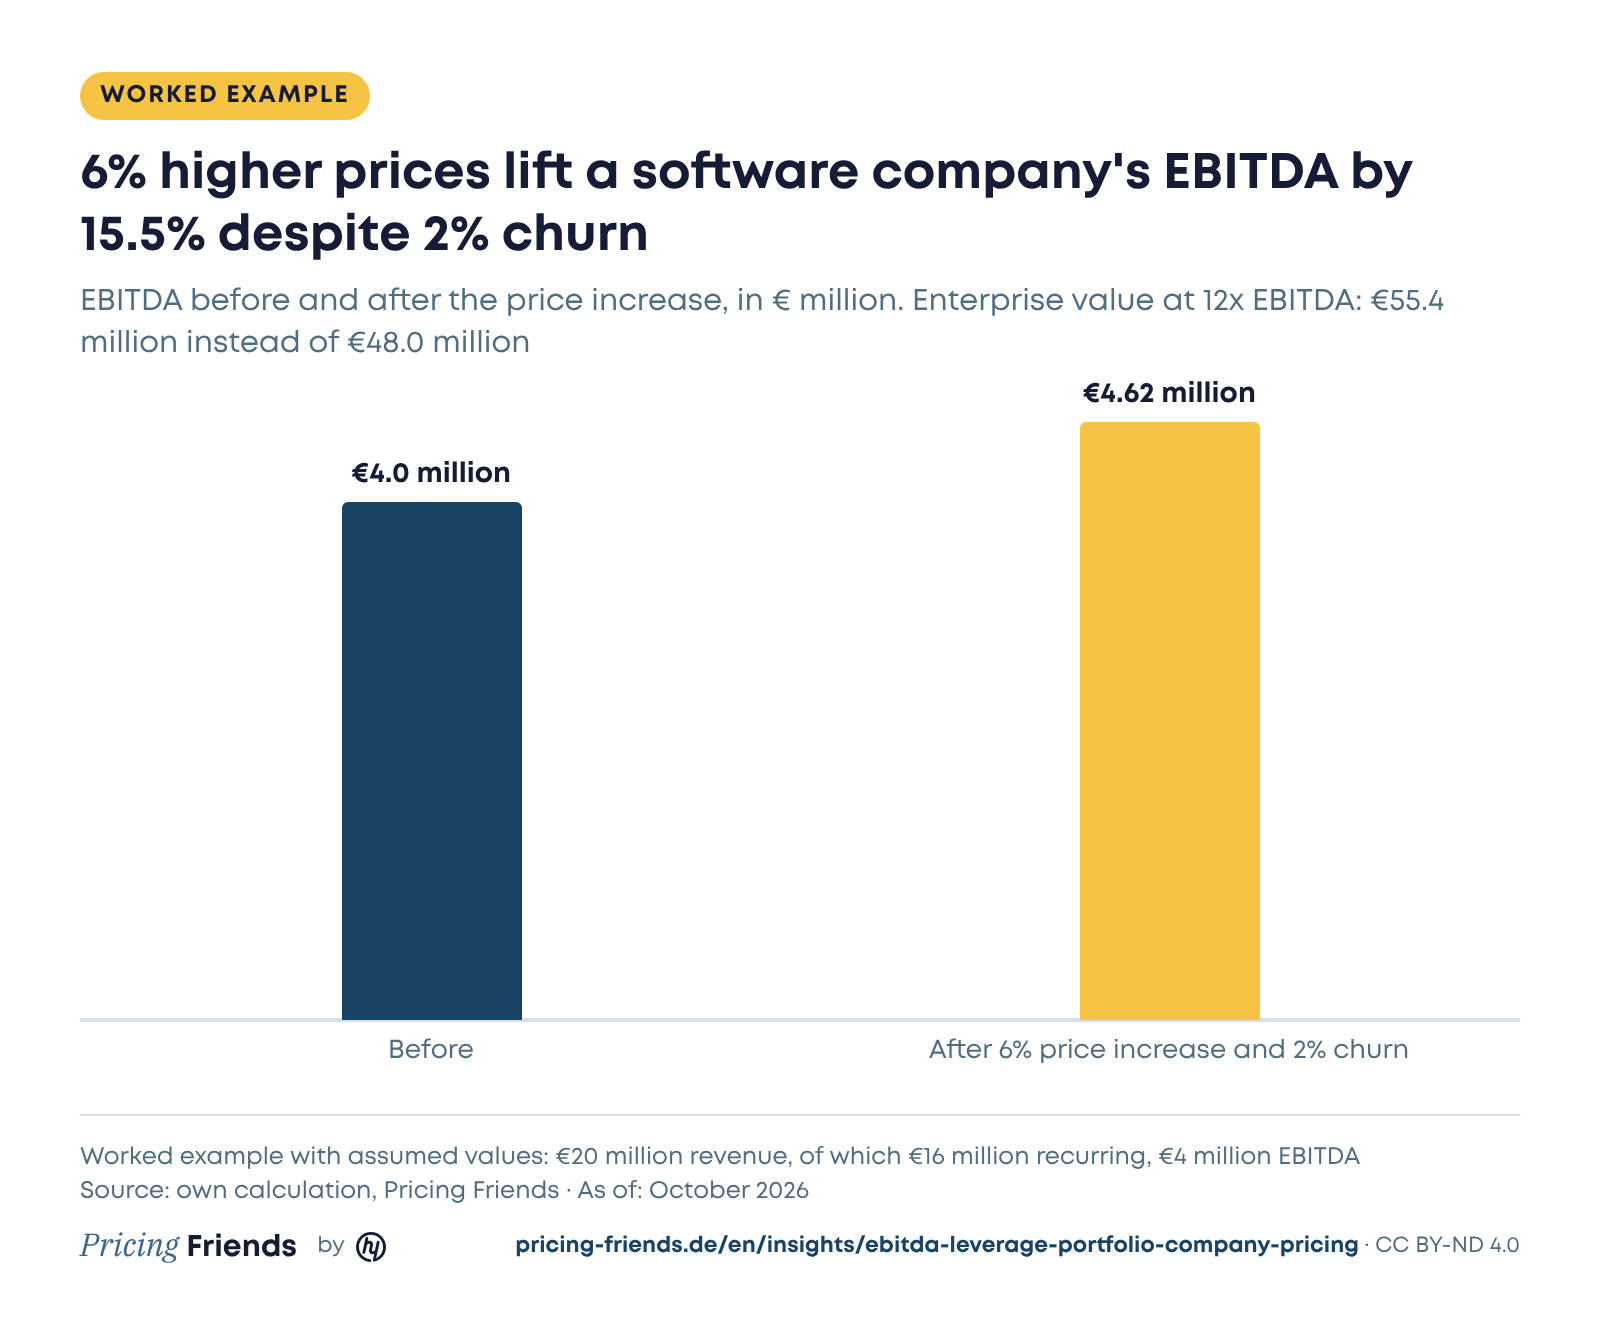
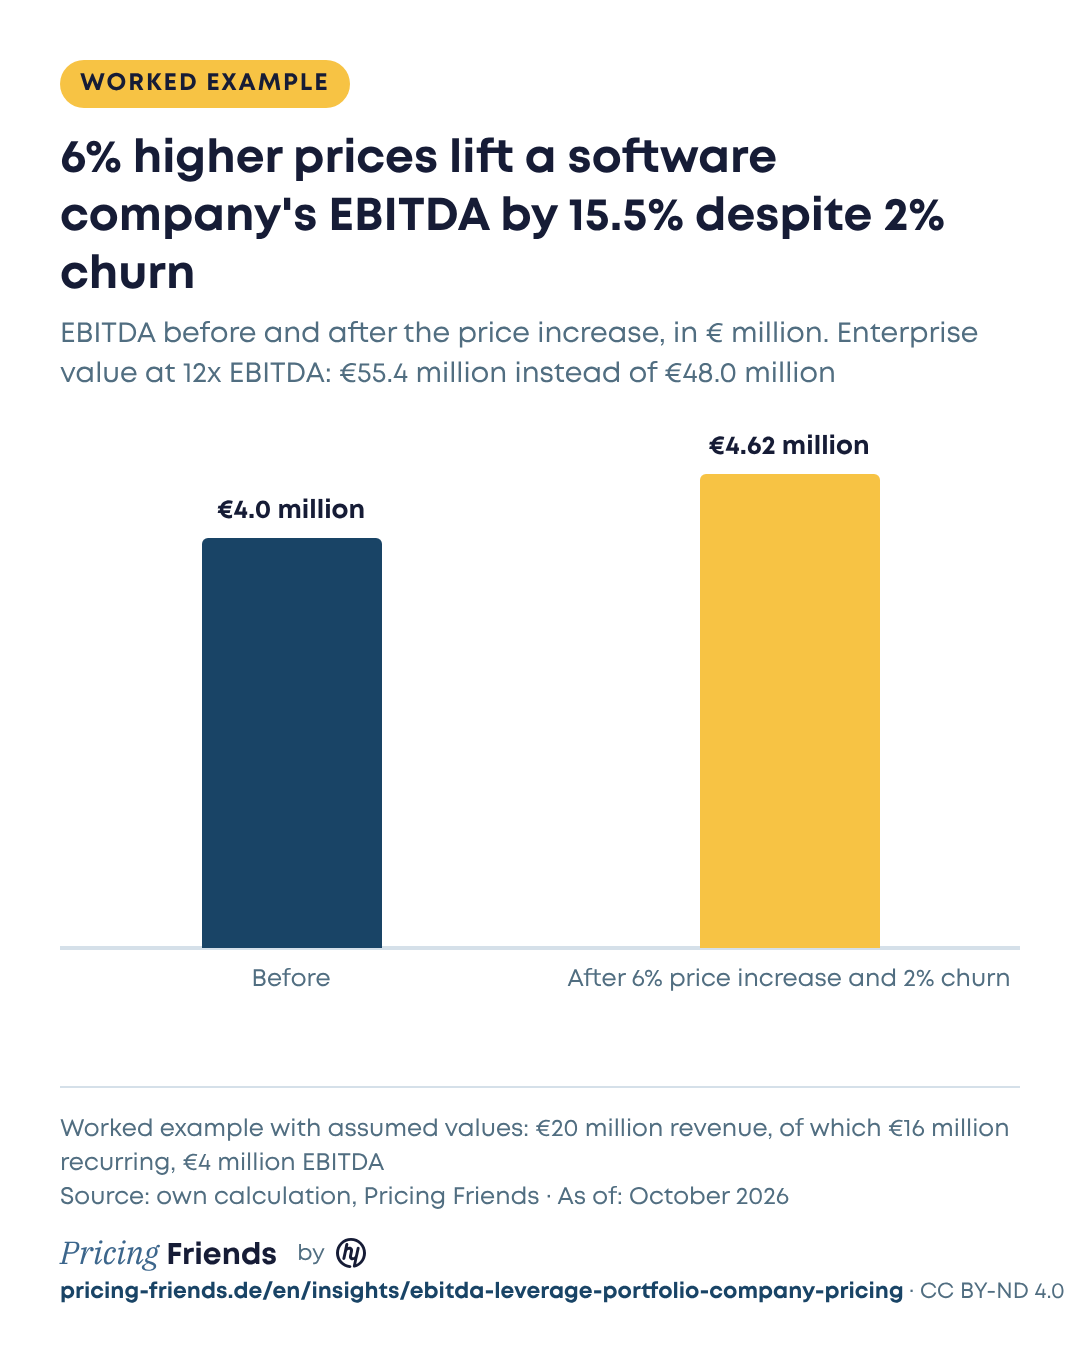
€0.62 million in additional revenue turns into 15.5% more EBITDA and €7.4 million more enterprise value, without the multiple moving. If the multiple rises because growth and predictability improve, the second effect from the previous section is added.
How much churn a price increase can absorb
Management's most common worry is losing customers. The table below is pure arithmetic: It shows how much revenue you can lose to cancellations before revenue falls below the old level.
| Price increase for existing customers | Revenue loss at which revenue falls |
|---|---|
| 3% | 2.9% |
| 5% | 4.8% |
| 10% | 9.1% |
| 15% | 13.0% |
| 20% | 16.7% |
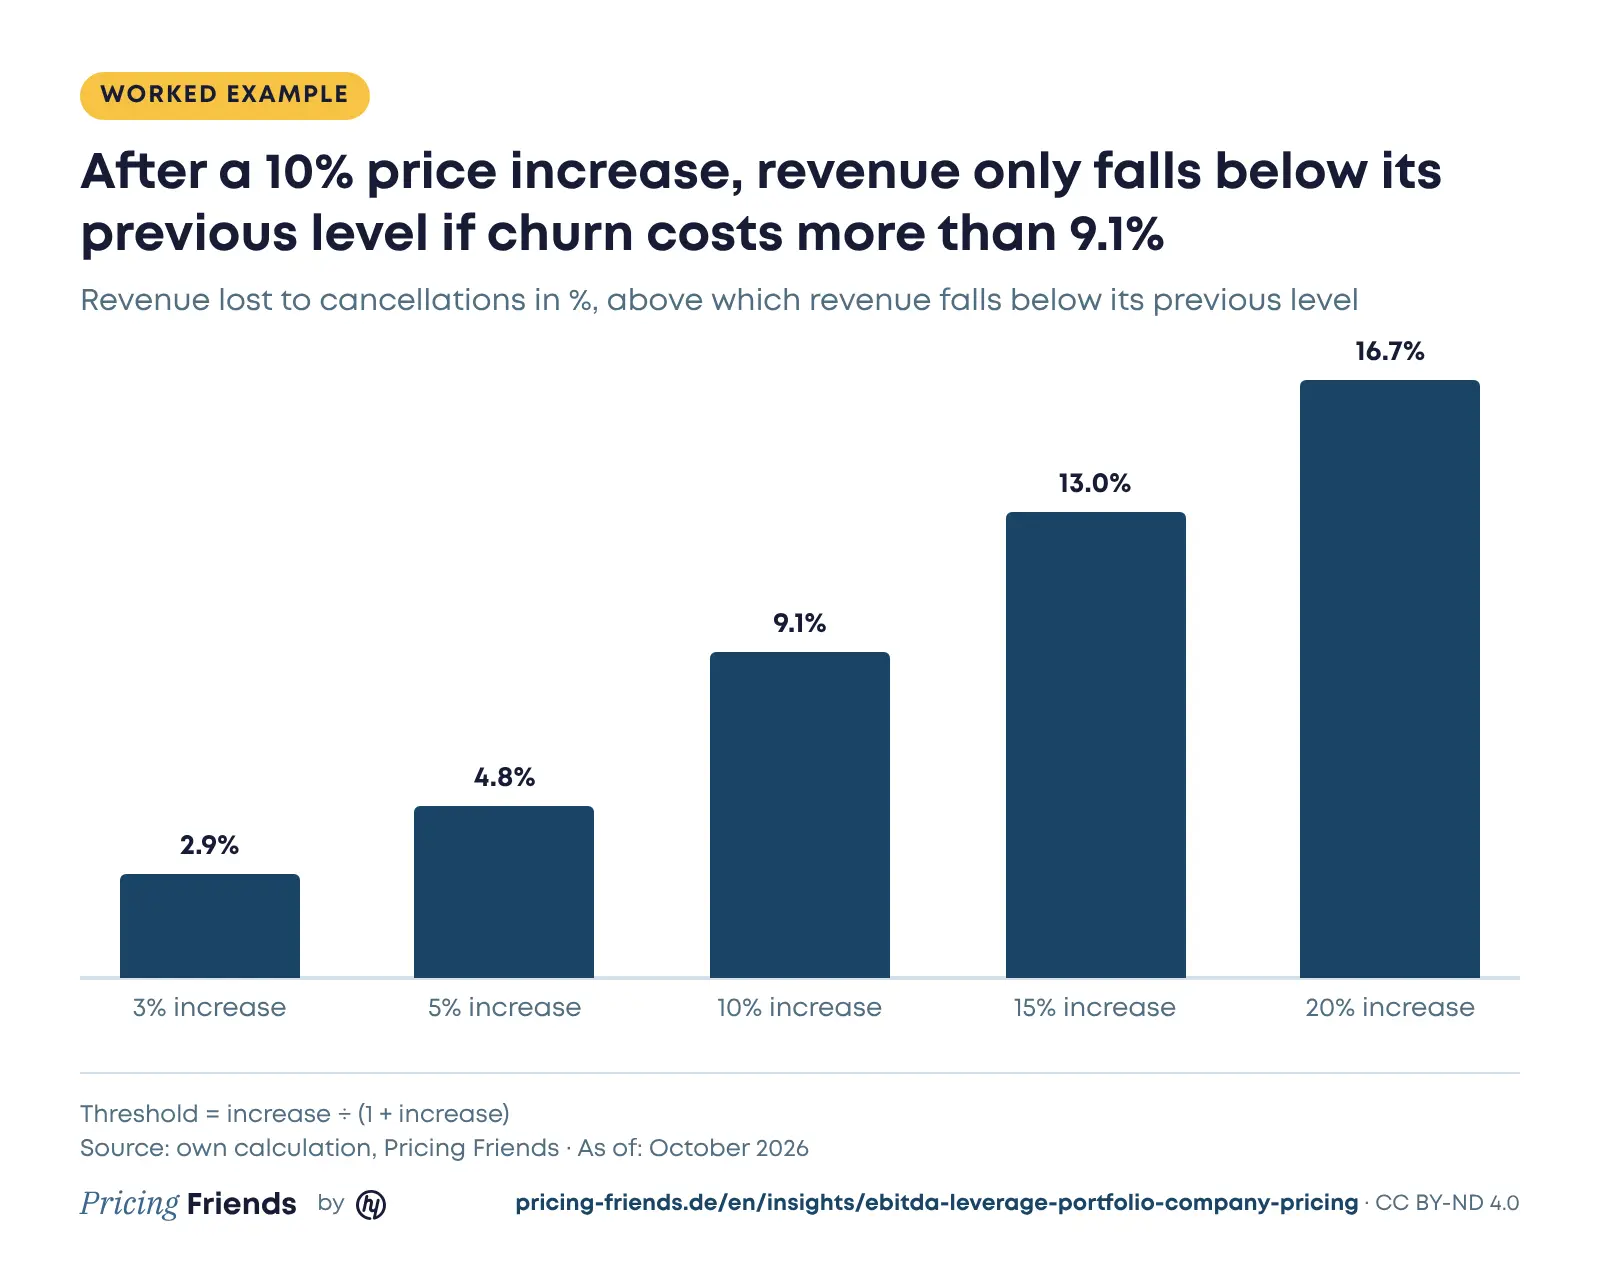
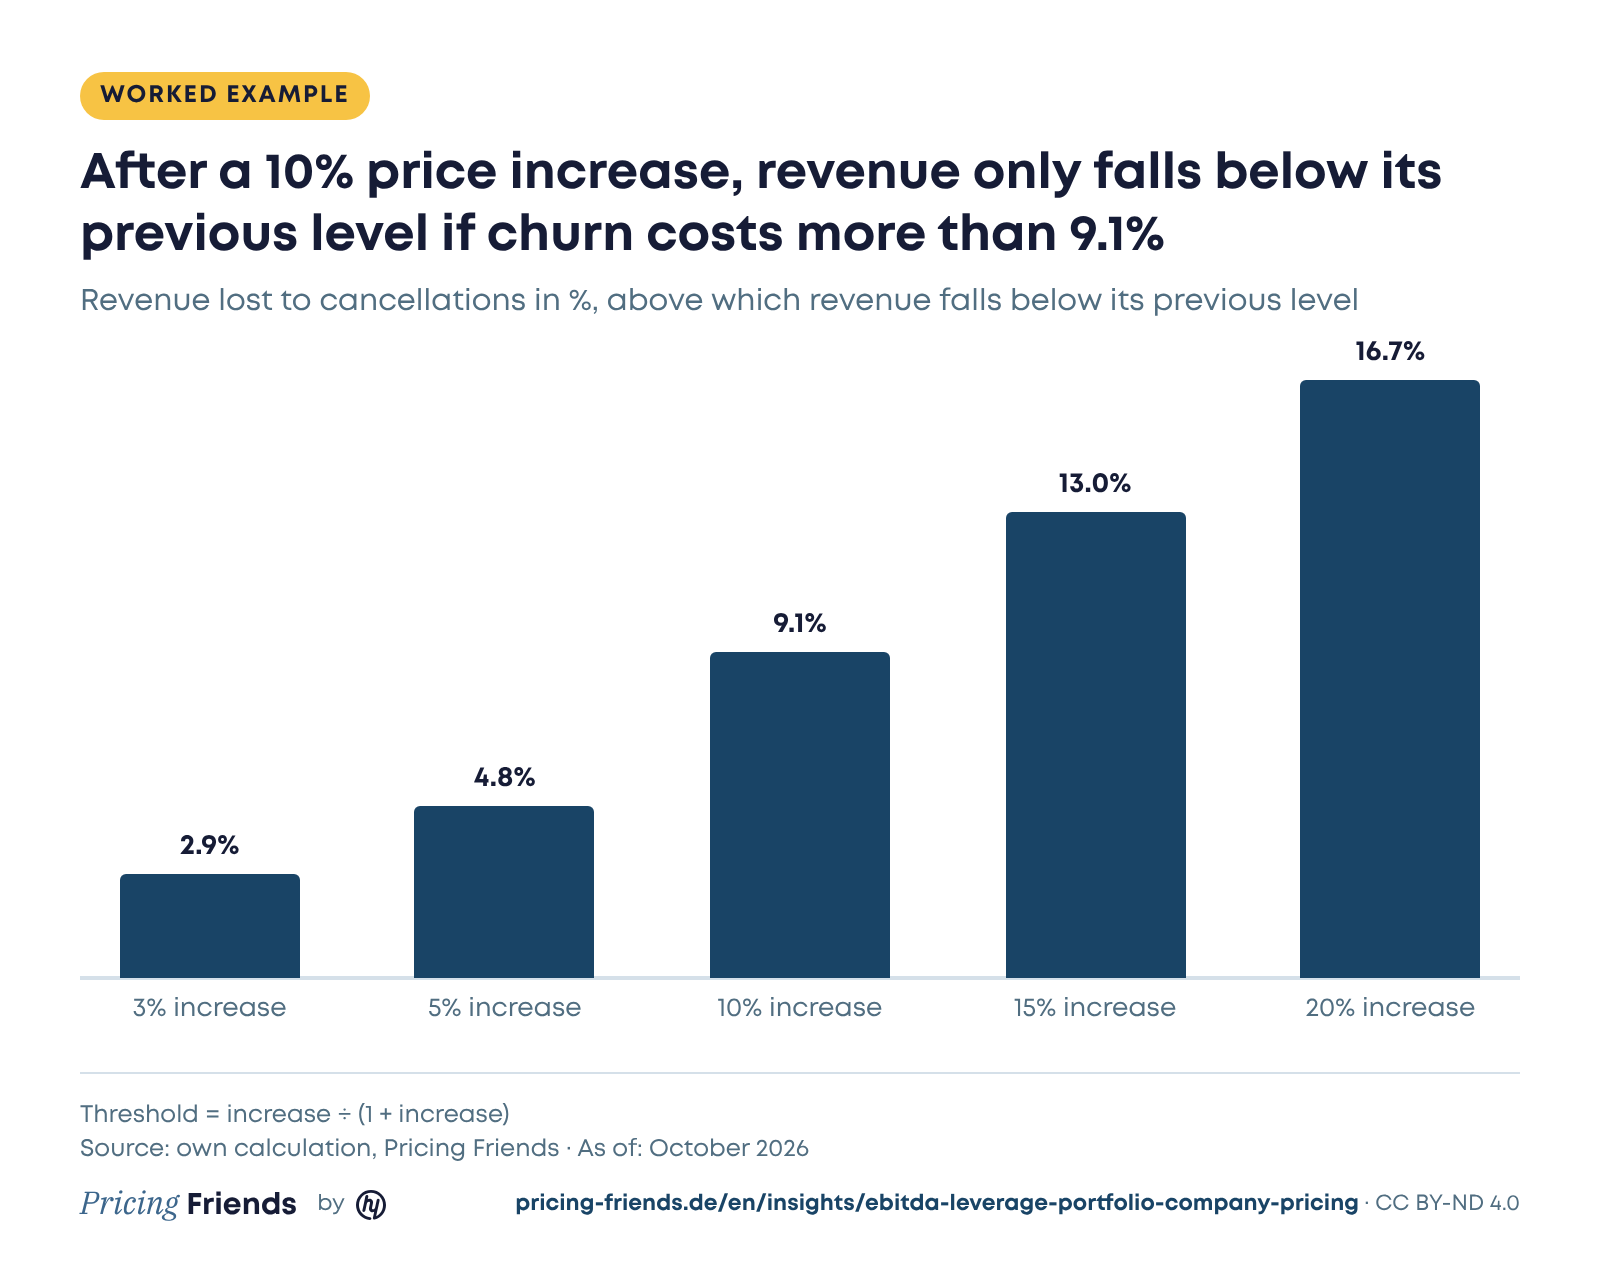
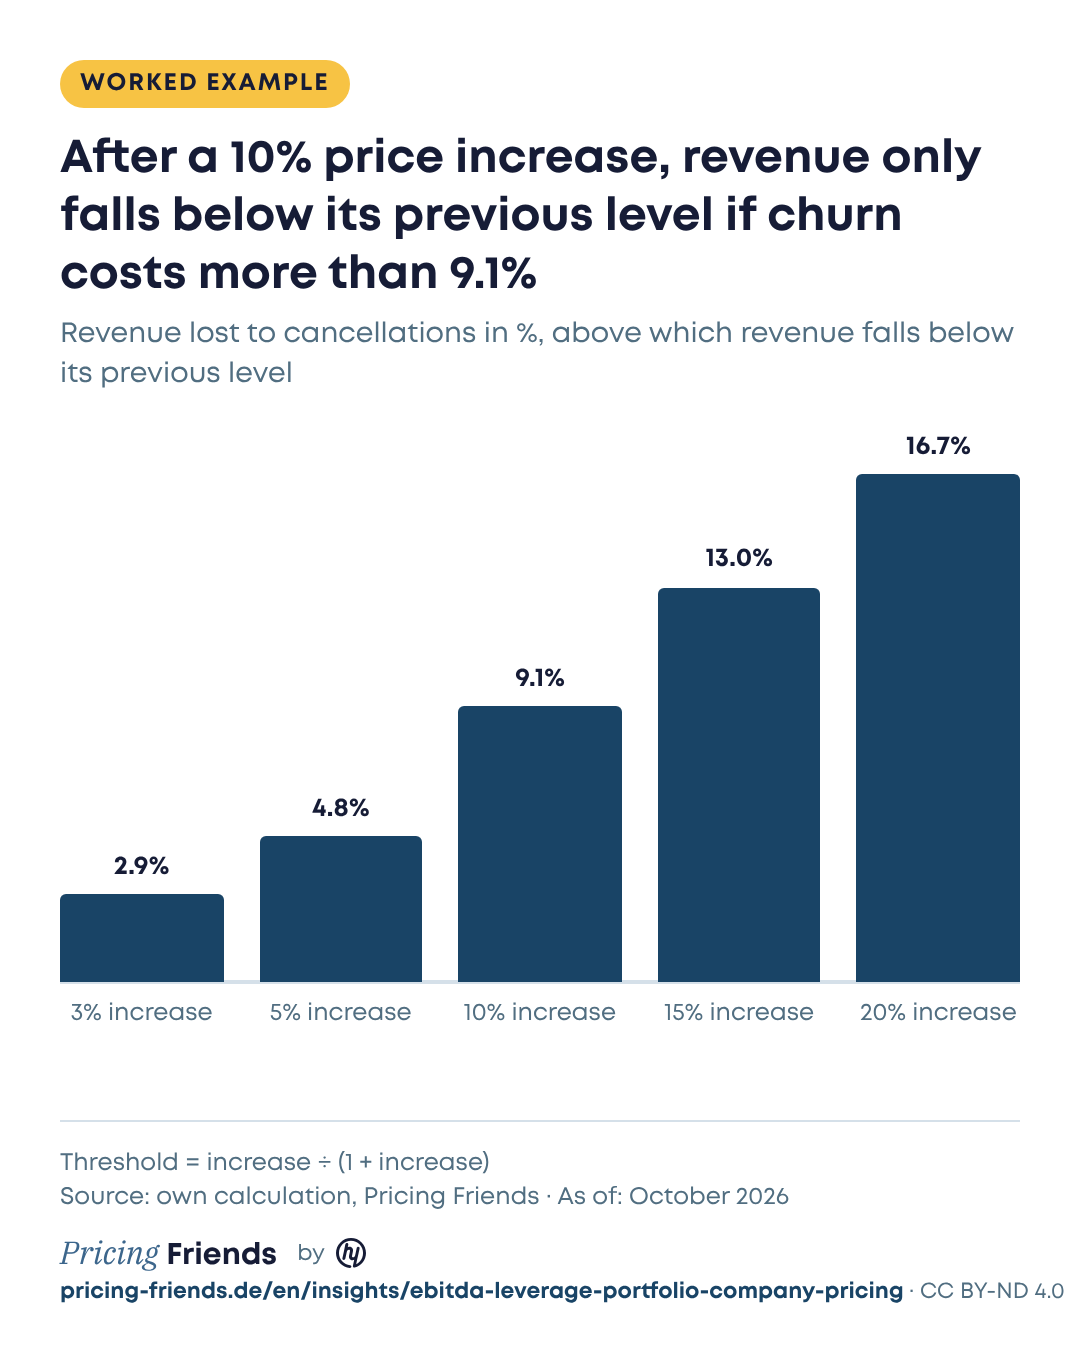
For EBITDA, the threshold is a bit higher still, because customers who leave no longer need support. In practice, churn rarely gets that high. In software models, we often see retention above 90 to 95% after price increases. So the more important question is usually whether sales enforces the new prices or gives them back through discounts.
What size is realistic
The market gives you a first read. For last year's report, we analyzed the prices of around 100 software vendors on the German software review platform OMR Reviews. In 67% of price increases, the increase was between 0 and 20%. Most SaaS vendors adjust their prices regularly by around 10%, often well above the inflation rate. For comparison: According to the Federal Statistical Office of Germany (Destatis), inflation in Germany was 3.3% in September 2026, the highest since December 2023.
At older software companies with a license and maintenance business, there's often more room, because existing customers haven't seen an adjustment in years. There, a one-time adjustment above this range is easier to justify, especially when it comes with the switch to a subscription.
Where the lever is bigger than the price list
The list price is only one part. Other levers are discount discipline, plans and add-ons, and the pricing model itself. Felicitas May, investment director and head of value creation at Beyond Capital Partners, compared pricing with specific AI projects in episode 147: “An add-on strategy like that or a good new pricing strategy sometimes gets me more EBITDA points than the specific use case does right now.” In the episode, I promptly noted that EBITDA is raised most by pricing. She pushed back right away: “I didn't say it like that.” The honest word in her sentence is “sometimes,” and I'll let it stand.
With the pricing model, the lever builds more slowly. Hybrid models combining a base fee and usage are currently the main model for 34% of the 153 SaaS and AI vendors in our online survey; 63% expect them to be the most important model in two years. If you simply bundle AI features into the core product, you carry the costs and don't earn an extra euro. You can fix that with a base fee plus usage.
Where the lever ends
Not every portfolio company has pricing power. Spiegel himself limits the lever: It works where products are hard to replace. In highly competitive segments, pricing power is often missing. A second limit is seat models in markets where customers need fewer users thanks to AI. As the future main metric, the seat loses 31 percentage points in our survey. There, a price increase helps in the short term, but the model still has to be rebuilt. In a rebuild like that, a specialized pricing consultancy such as hy puts a number on the lever up front and sets the order in which plans, pricing metric and existing customers are adjusted.
We expect the lever from the price level to be used up in many holdings after two years. The bigger remainder comes from the metric: whether the price grows with the work the software does for the customer.
What you can do on Monday
- Write down existing-customer revenue and margin. Recurring revenue from existing customers, EBITDA margin and assumed exit multiple for each portfolio company.
- Find the last price adjustment per customer group. Anyone who hasn't adjusted in several years goes to the top of the list.
- Build the churn table. Calculate how much revenue loss you can absorb at 5, 10 and 15%.
- Compare realized price with list price. High discounts shrink the lever before a price increase takes effect.
- Prioritize the levers. Place pricing in the value creation plan and decide which KPIs you'll measure it by.
Bottom line: Price works twice, through earnings and through the multiple
A price increase for existing customers goes almost entirely into EBITDA, and it shows buyers that the customer relationships are strong enough for new prices. How big the lever is depends on the time since the last adjustment, on discount discipline and on the pricing model. The churn management fears most is usually the smallest item in the calculation.
The portfolio check shows where in your portfolio to start: You enter up to ten domains and get a score from 0 to 100 for each company, its pricing model in one line and the key finding. The overview arrives by email.
Sources
- SaaS & AI Pricing Report 2027 by hy, pp. 11, 12, 30, 32
- SaaS & AI Pricing Report 2026 by hy, pp. 41, 46
- Federal Statistical Office of Germany (Destatis): inflation rate of +3.3% in September 2026, press release no. 364 of October 13, 2026
- Pricing Friends, episode 5: Private Equity und Pricing mit Andreas Spiegel: Wie revolutioniert effektives Pricing den Wert von Softwareunternehmen?
- Pricing Friends, episode 129: Private Equity und Pricing mit Dr. Stephan Schmid
- Pricing Friends, episode 147: AI Value Creation im Private Equity: Wie wird aus KI-Effizienz echter Umsatz?
Quotes are translated from German. The podcast episodes are in German.